Monitoring the Earth
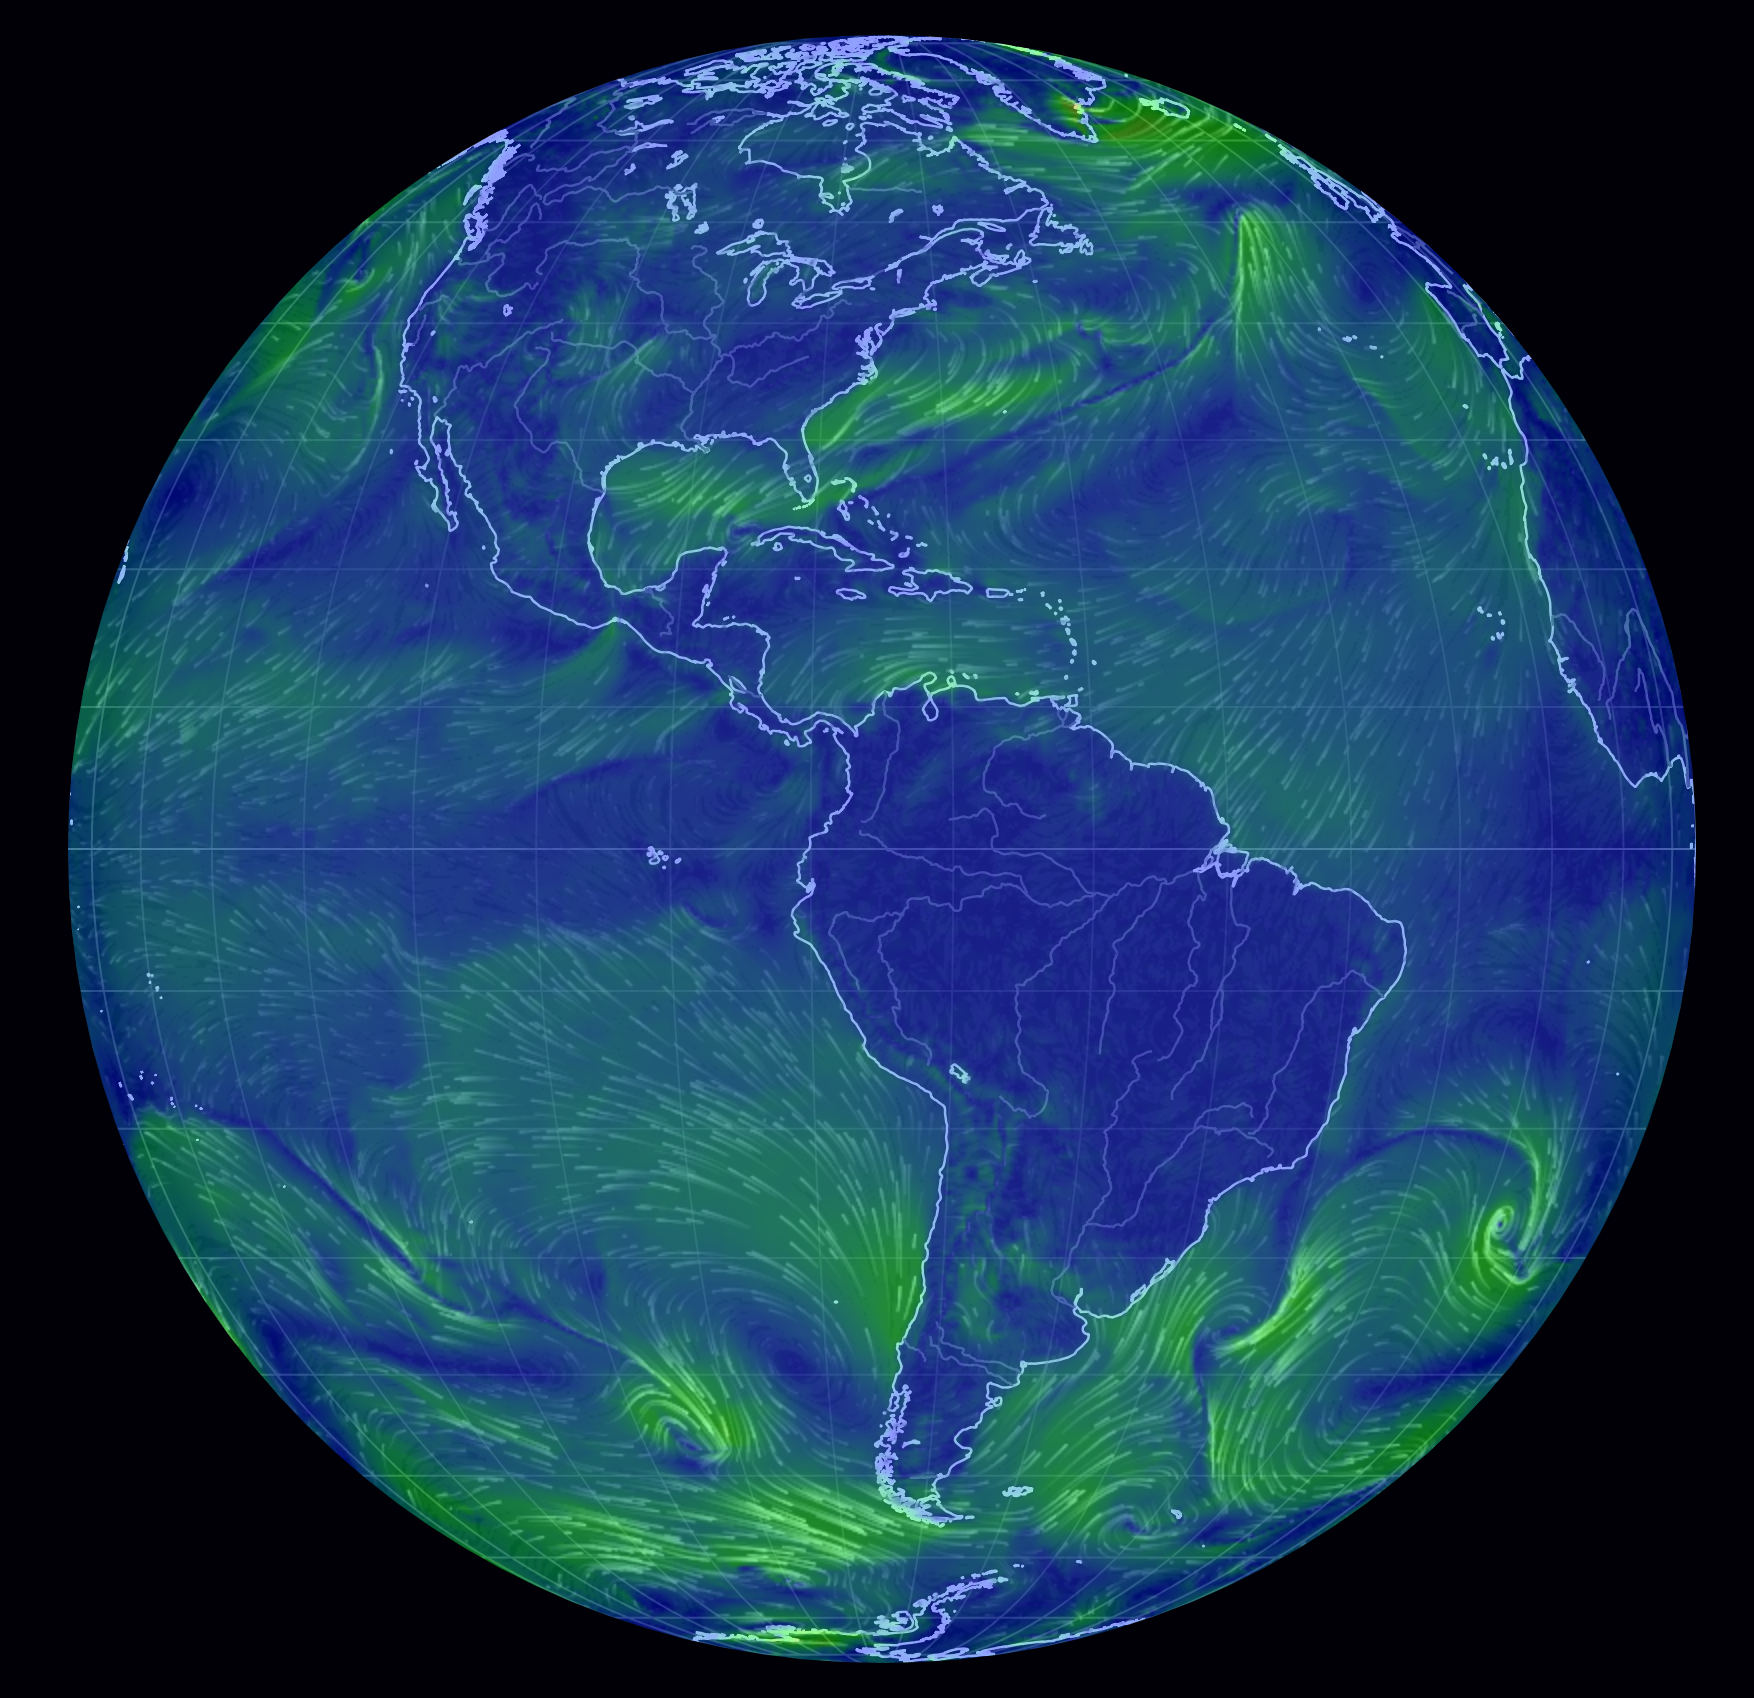
In a striking example of visual design and effective data communication, someone shared this site with me which takes in data from the US National Weather Service and displays a globe with the patterns overlaid. You can change the type of data from the menu in the bottom left. You can also zoom in & pan around to see your local area. It's really fun to look at during a window storm or rainstorm and see how the world is reacting.

